Our guide to solar energy as the electricity prices increase
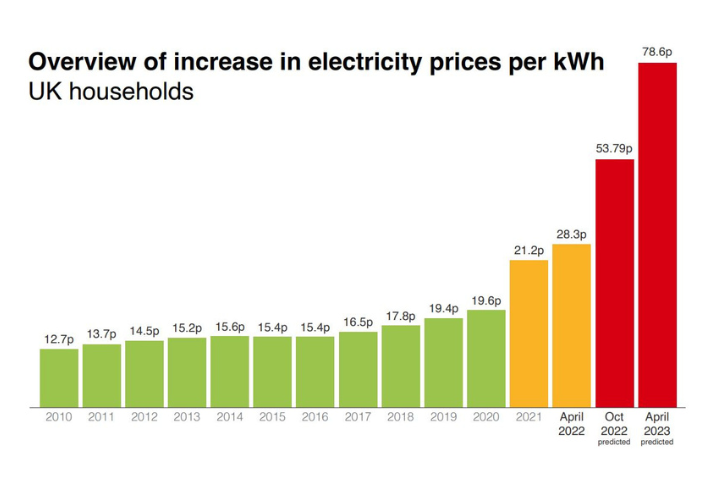
In October, the energy price cap is set to rise by 70%, increasing the average energy price to £3,359 a year for a typical home. By April 2023, the cost of electricity has been predicted to reach 78p per kWh.
Next week, Ofgem will officially announce the next energy price rise on Friday, 26 August 2022, and it will apply to most variable tariff energy bills from 1 October 2022 to 31 December 2022.
The headlines about the energy crisis are daily. The energy market faces unprecedented challenges, and a winter of discontent in the UK threatens. It all seems so overwhelming. But what does it all mean? And what does it mean for solar energy? In this guide, we will try to answer the questions you currently might have about energy prices in the UK, how solar energy will be impacted and what it could mean for you and your home.
Energy caps, electricity prices and p/kWhs – what do they all mean?
There’s lots of news about energy prices with percentages and numbers flying about. It sounds like a maths class, but at worst, it feels like an impenetrable jumble of facts and figures. It is frustrating, especially when all you want to know is how you will be affected. This guide will explain what’s going on and what it could mean for solar energy systems in your home. But firstly, to make this guide as helpful as possible, here are the seven key terms to help understand the energy crisis.
Top seven terms to help understand the energy crisis
1. What is Ofgem?
Ofgem is the government department which regulates and oversees the UK gas and electricity companies, and Ofgem stands for the Office of Gas and Electricity Markets. It’s a non-ministerial government department and acts as an industry watchdog. The main objective it states is s to protect “the interests of existing and future gas and electricity consumers,” both domestic and industrial.
2. What is the energy price cap?
The energy price cap is the maximum amount that can be charged to customers on a variable dual-fuel rate for typical usage of gas and electricity for six months. Ofgem brought it in in 2019 to prevent households on specific expensive variable tariffs from being ripped off. It limits what you pay for each unit of gas and electricity you use and is based on several factors, including the wholesale cost of energy in the previous six months (soon to change to three months).
3. What is the daily standing charge?
The daily standing charge is a fixed daily amount you have to pay to have your house connected to the grid, no matter how much energy you use. A standing charge covers the cost of supplying your property with gas and electricity. Standing charges for gas and electricity can vary by region and supplier, but Ofgem sets a maximum daily standing charge through the energy price cap. It’s a bit like a line rental for a phone, and it covers the costs needed to provide your home with energy.
4. What are wholesale energy prices?
The wholesale cost of energy is the price suppliers have to buy the energy from the wholesale market. They then add a variety of costs (distribution fees etc.) before arriving at a price they charge you.
5. What are tariffs?
A tariff is a temporary contract which sets the amount you pay per unit of energy for the duration of the contract. The main types of tariffs are variable rate (where the price you pay for each unit of energy you use can go up or down) and fixed rate (where the cost per unit is set for a stated period, usually 12 months). Fixed rate, fixed term tariffs tend to be cheaper than their variable rate counterparts. If you’ve never switched suppliers or haven’t switched for a few years, you’re almost certainly on a variable (sometimes known as ‘default’) tariff. You can also get green tariffs, which promote environmentally-friendly energy production.
6. What is a kWh?
A kilowatt hour (kWh) is a unit of measurement for how much energy you use. Although it might sound like it, it doesn’t mean the number of kilowatts you’re using per hour. 1 kilowatt hour is the amount of energy you’d use if you kept a 1,000 watt appliance running for an hour. Different devices around your home use different amounts of power, and 1kWh can power various appliances for different amounts of time depending on their wattage (or power). For example, 1kWh powers an electric shower (10,000 watts) for 6 minutes, a fridge-freezer (200-400 watts) for about three hours and a laptop (20-50 watts) all day.
7. What is p/kWH?
This stands for pence per kWh and is the unit charge shown on your energy bills for the cost in pence of 1kWh of energy to your home.
With these seven key terms, we can begin to explain what is happening with energy prices and what it means for solar energy.
What’s happening to energy prices and what’s going to happen to energy prices?
The current energy situation is impossible to ignore. Descriptions and news about an energy crisis are everywhere. And while the media loves to throw words like ‘crisis’ and ‘unprecedented’ around all the time, the current situation regarding energy prices and what they are predicted to rise to in the next few months is causing severe and genuine cause for concern for everyone with energy bills. What follows is a summary of where we have come from with energy prices, what’s happened to energy prices, what is predicted to happen to energy prices and how all this has, is and will affect solar energy prices.
Where were we with energy prices (and what that meant for the cost of solar energy)?
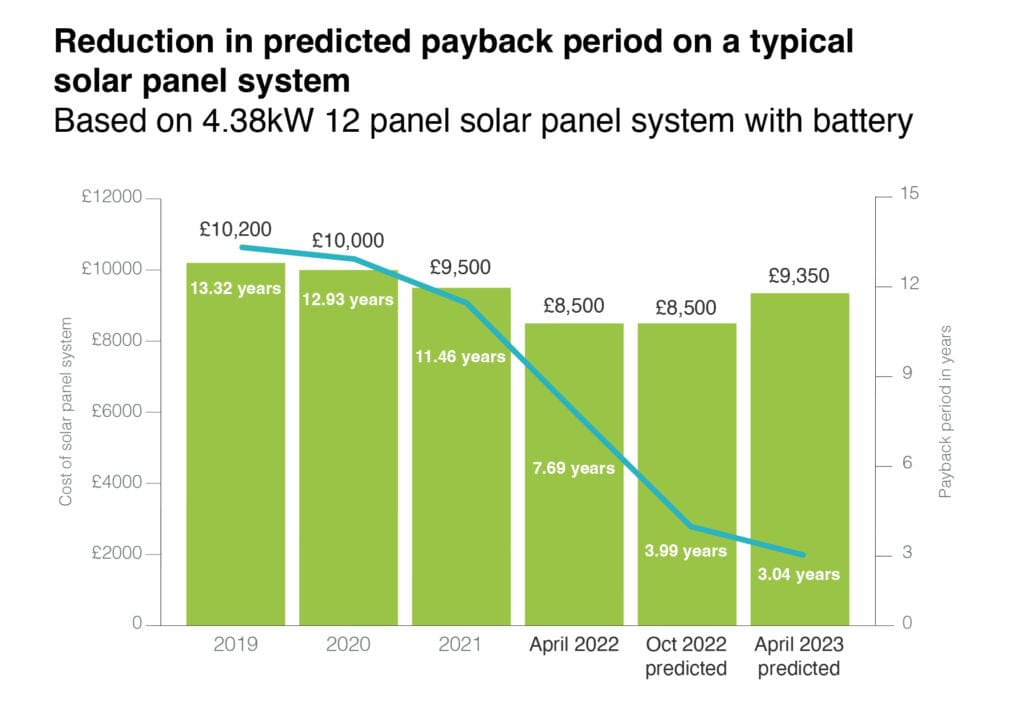
When energy prices were at these levels, a 12 panel 4.38kW solar PV system with a battery cost approximately £10,200. A system like this would have saved the average home about £765 in energy costs per year, which meant that payback time (the time taken to break even on your solar investment) was around 13 years. It is worth remembering that the costs of solar technology and installation in 2019 were higher, and there was more variation in the equipment specification.
In January 2020, the Smart Export Guarantee replaced the Feed In Tariff (FIT) scheme. Like the FIT scheme, it pays you for any electricity that an installed solar energy system doesn’t use and sends back to the grid. It requires a smart energy meter to work so that the energy provider can see how much electricity has been exported. Under the scheme, all large energy suppliers had to provide at least one SEG tariff; however, energy companies paid (and still do pay) different rates.
What happened in April 2022 and where are we now with Energy Prices (and what this means for the cost of solar energy)?
On Friday, April 1st 2022, while it might have felt like a cruel April Fool’s joke, as we all know, Ofgem increased the energy price cap. It rose by an average of 54%. This meant for a typical household paying by direct debit; it was now £1,971/year – up by a massive £693/year from its previous level of £1,277/year.
For customers on prepay, the price cap also increased by 54%, from £1,309/year to £2,017/year on typical use – a rise of £708/year. Of course, the new cap level isn’t the maximum anyone will pay. The price cap limits the rates you pay for each gas and electricity unit, so if you use more, you’ll pay more. The average price-capped rate for electricity now is 28.35 p/kWh, and the average standing charge is 45.34p per day. Before this, in March 2022, the average price-capped rate for electricity was 20.8p/kWh, and the average standing amount was 24.88 pence per day.
At the current prices, this means a 12 panel system 4.38kW solar PV system with a battery costing approximately £8,500 saves the average home about £1,100 in energy costs per year, which means that payback time (the time taken to break even on your solar investment) is around seven years.
Why did energy prices rise so much in April 2022?
Many explanations are flying around on why UK energy prices are rising. The tragic events in Ukraine, a post-Covid rebound, and the impact of energy suppliers going bust are all discussed as reasons for increasing energy prices. These factors are certainly contributing to the rise; however, when it comes to the UK, it is the price of gas that really impacts our energy prices.
In the UK, 85% of households use gas boilers to heat our homes, and around 40% of electricity is generated in gas-filled power stations. For comparison, fewer than 50% of homes in France and Germany are heated with gas boilers. When this is coupled with the fact that the electricity market operates in a way that means the price of power is almost always set by the price of gas, the UK becomes particularly exposed to high gas prices. And when the gas price has increased 11-fold since 2019, the UK energy prices are significantly impacted.
A continued lack of investment in renewable technologies by the UK government means the UK remains too susceptible to gas prices, so if world events continue to increase, you can assume that means that UK energy prices will rise too. And that’s what has been predicted.
What’s predicted to happen to energy prices (and what this could mean for the cost of solar energy)?
All talk about the energy crisis has now turned to what will happen in October. At the start of this month (August 2022), Ofgem announced that the energy price cap and how much energy suppliers can charge households would change every three months instead of every six months. This means changes in January, July, and the usual April and October changes. We can therefore expect two price rises this winter. The first in October and the second in the depths of winter, in January. Ofgem says this will provide greater stability and reduce the risk of supplier failure, but the reality is that households face energy bills like never before.
Several financial organisations and consultancy firms have already forecasted and predicted October’s rise. If these predictions are correct, and they have a history of being pretty accurate, then domestic energy bills are due to reach new highs of more than £3,500.
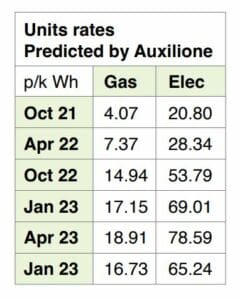
Initially, a 70% price rise in October was predicted to increase the average energy price to £3,359 a year for a typical home, before a further 8% rise in January to a typical £3,616 a year. However, in the last few weeks, the predictions from analysts have become even starker. On 4 August, Investec forecast an increase in the cap to £4,210 on 1 January. By 9 August, Cornwall Insights was forecasting £4,266 for January and £4,426 from 1 April 2023. And by 10 August, Auxilione was putting the January price cap at £4,467, and its forecast for April 2023 reached £5,038.
The graph below, which uses the price data from Auxilione, shows how much energy prices could cost at different levels of household usage according to Ofgem data.
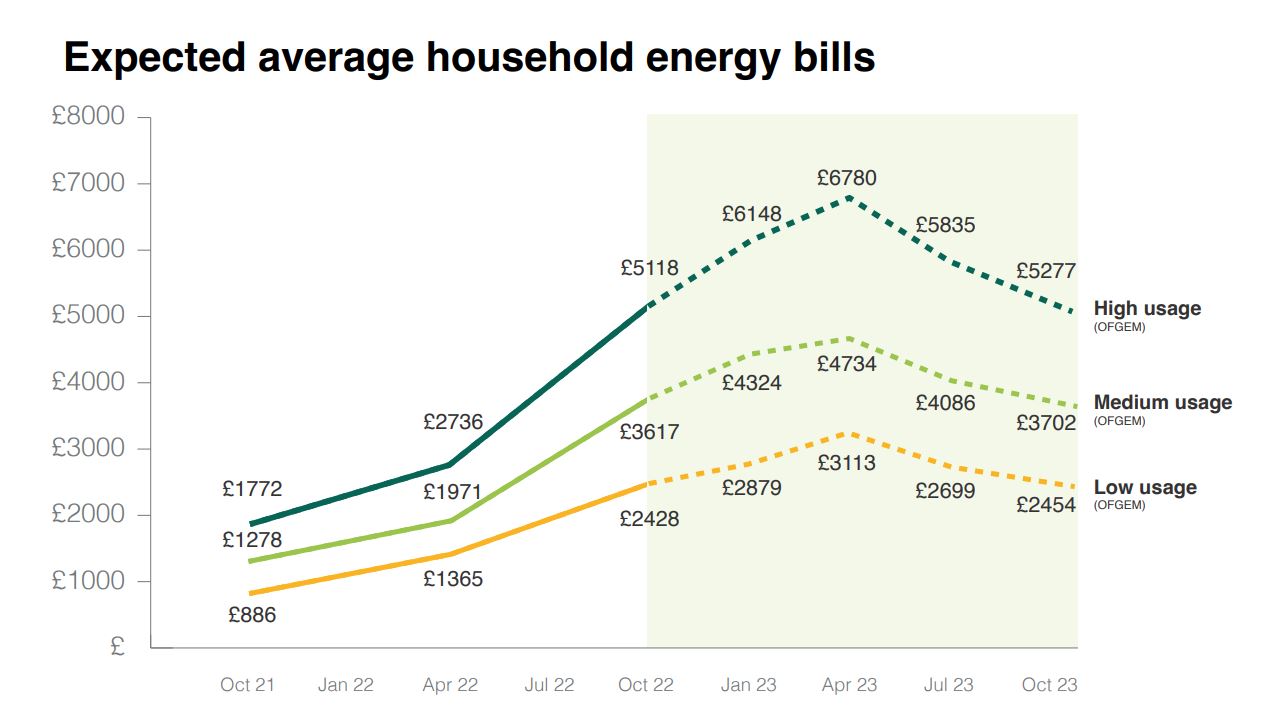
Households with high energy usage could see bills peaking at £6,780 a year at April’s predicted prices.
If such forecasts prove accurate, bills will have risen from £1,138 per year for the average household in summer 2021 to over £5,000 per year in April 2023, more than a four-fold increase in just 18 months.
To put this in historical context, the current crisis is so severe that the average family home will face “dual-fuel” gas and electricity bills nearly three times higher than anything they have experienced since 1970. Furthermore, the least efficient homes face bills up to £2,000 higher than those rated with an EPC “C” or better.
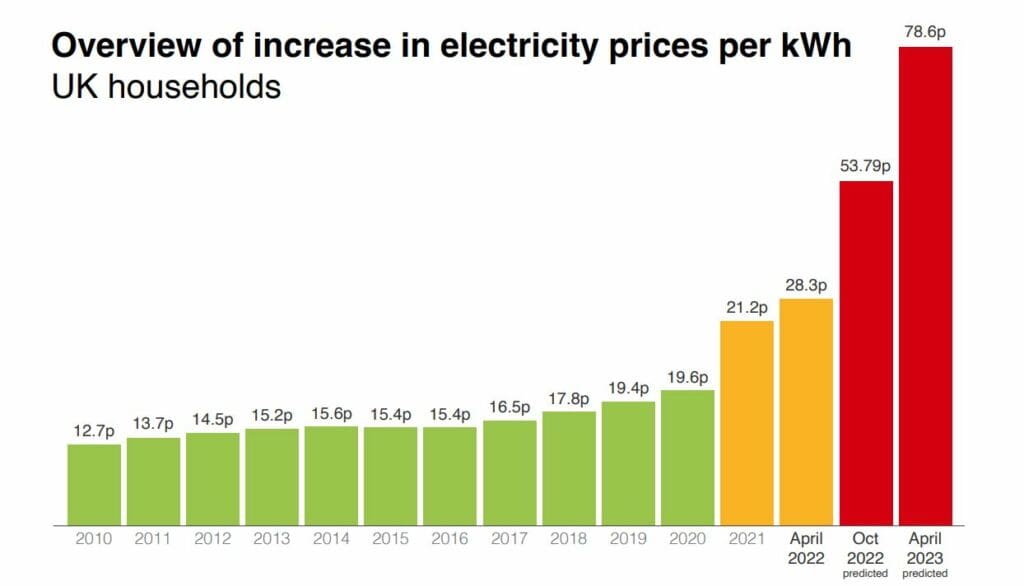
Based on these predictions, the electricity price will be 78 p/kwh in April 2023. The savings that a solar installation produces become even more significant at such prices.
In April 2023, at the predicted prices, a 12 panel 4.38kw solar system with a battery, we expect, will cost £9,800. It will save the average household just over £3,000 a year and will have a payback in just three years.
It’s clear that very soon, households will need to find ways to save money at home. It is possible to save around £300 by making simple changes to your boiler settings. However, more significant savings are possible through better insulation, improving the fabric of your home, and using renewable and low carbon technologies like solar panels, batteries and electric vehicles.
Case Study
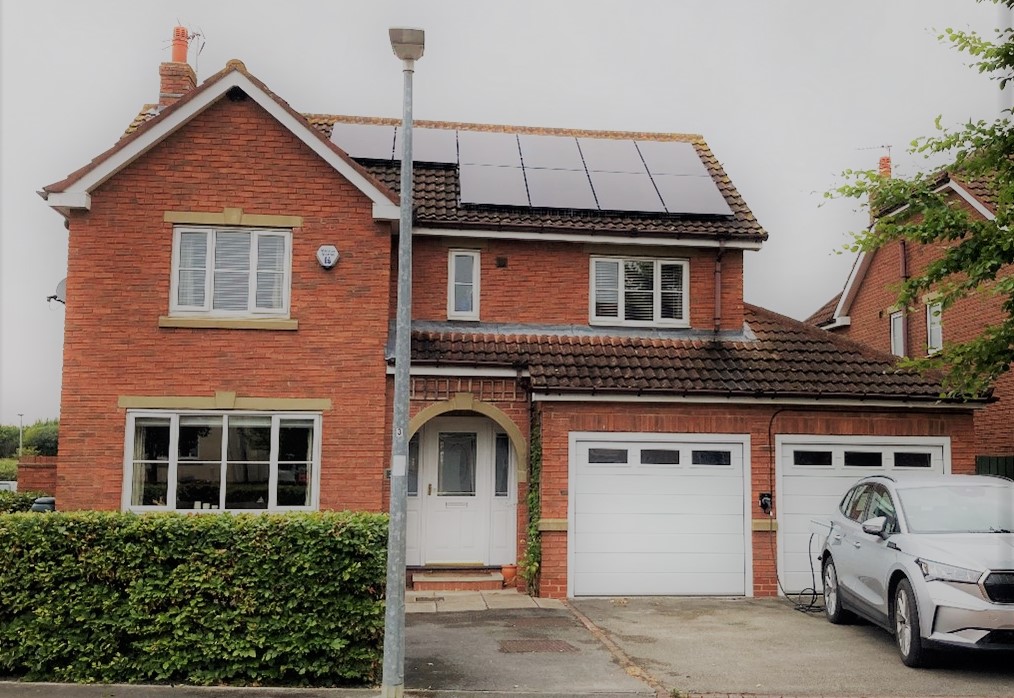
Green Building Renewables customer, Mr Floyd, provides an excellent example of the cost of living savings that can be made when a solar panel system is coupled with an electric vehicle (EV). An EV is, in essence, another form of battery storage and a way to make the most of the excess solar energy you generate. Indeed when Mr Floyd bought his EV, its battery was significantly more significant than the battery storage available.
After having his EV for 12 months and following the increases in energy costs from October 21, he has sufficient data to analyse his electrical costs from the last year.
For Mr Floyd’s four bed, three bathroom, double garaged home, his total cost of electrical energy from July 2021 to July 2022 was £1620. This energy provided central heating (via his air source heat pump), domestic hot water heating, all cooking, and power for his EV, a Skoda Enyaq IV 60, which completed 10,000 miles in the same period.
He added £175 of additional power to his car from public EV power points, mostly 50kW devices currently costing almost 50p/kW and his first annual service cost him only £56.
Compared with a fossil fuelled vehicle doing an average of 50miles/gallon at £1.85/litre, he estimates that he has saved £1700 on fossil fuel costs.
Put another way, thanks to his solar panels, his air source heat pump and EV, his energy costs have significantly reduced and given him 10,000 miles of free motoring whilst also reducing his CO2 footprint.
How Green Renewables can help you understand solar savings for your home
At Green Building Renewables, we have created a solar panel calculator that allows you to determine whether your home is suitable for a solar panel system and how much a system could save your home. Why not try it today to find out how much you could save?
The demands for solar panel systems, battery storage and EV charging at Green Building Renewables are constantly increasing. As the reality of rising, fossil fuel prices continue to hit home or rather hit homes; we are seeing more and more people enquire about how they can save money with renewable technologies. We’re here to help. The UK’s transition to renewable energy and low carbon technologies is paramount. We want to help transform homes across the country so families can save money, reduce their reliance on the grid, and lower their environmental footprint. We are building a network of local renewable energy experts around England and are ready to listen to your needs. Contact our team today if you are interested in transforming your home for the future.
Other Useful External Resources (and sources for this article) to help you understand the energy crisis, the predicted energy rises and what’s going on are available below:
Money Saving Expert – What is the energy price cap?
Money Saving Expert – Energy Mythbusting
Energy Saving Trust – What is the energy price cap?
Ofgem – Check if the energy price cap affects you
Compare the market – What’s a standing charge?
Money Supermarket – The energy cap explained
Which – Cutting your energy bills
Which – Feed in Tariffs explained
Carbon Brief – Analysis why energy bills are rising
More To Explore

Christmas greetings from 21 Degrees
As the festive season approaches, we would like to take […]
5 (Good) reasons why heat pumps are more expensive than boilers
Heat Pumps cost more more money to install than gas boilers for good reasons. Here are five to read about.
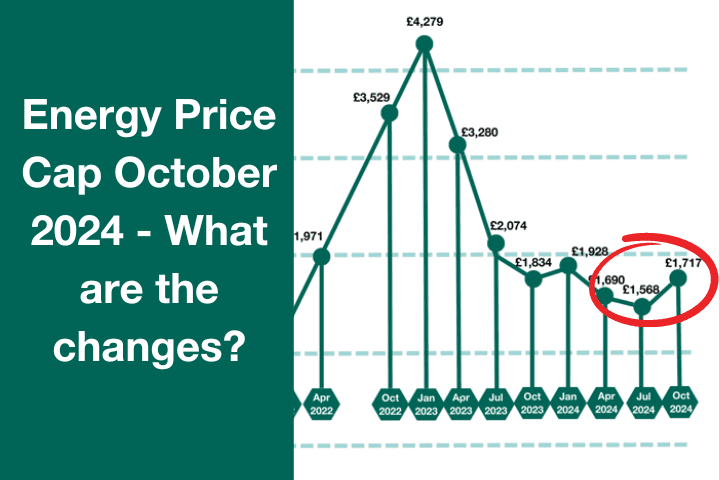
Energy Price Cap October 2024: Crucial things to Know
The Energy Price Cap has changed. What are the changes? What does it mean for you? Read our blog.


